
By: Ashley Ahearn, KUOW
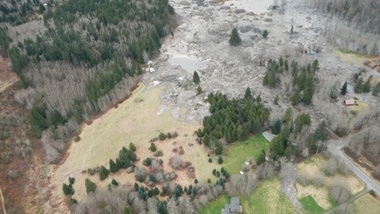
SEATTLE — Scientists have concluded that rain, groundwater seepage and a long history of big landslides likely contributed to the massive landslide of March 22 that killed 43 people and destroyed dozens of homes near Oso, Washington.
Those findings came out Tuesday, the result of a scientific team’s rapid-fire assessment of geology and localized factors.
Joe Wartman, a University of Washington associate professor of civil and environmental engineering and a co-lead author of the study, said rainfall very likely played a key role in the slide.
“It mobilized as the water entered the landslide mass. It raised the water pressure in that mass,” Wartman said, “And as a result the landslide mass lost its strength and it became a fluidized mass of earth and material.”
The U.S. Geological Survey estimates that 7.6 million cubic meters of earth slid down across the Stillaguamish River, spreading out for more than a kilometer.
The researchers also looked further back in history, reviewing evidence from a number of large landslides in the Stillaguamish Valley around Oso during the previous 6,000 years. The team estimated that, based on a review of carbon dating and maps of 15 similar historic landslides nearby, slides such as the March event have happened in the same area as often as every 400 to 1,500 years historically.
“The real different thing about that particular spot was how much it had failed in the very recent past,” said Dave Montgomery, a geomorphologist with the University of Washington and co-author of the report. “It had been chewed on a lot by prior failures.”
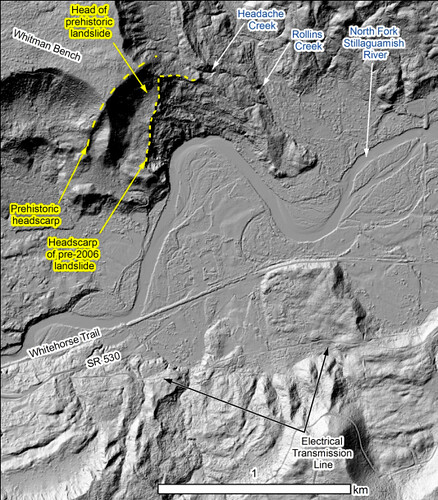
A 2003 lidar map of ground conditions where the Oso slide occurred.
The report authors said the landslide occurred in two phases. The first slope failure was a repeat of previous slides that had been documented as far back as the 1950s at that site. The most recent one to contribute to the March slide took place in 2006.
The second phase of the March 22 event tapped into a much deeper landslide history at the site.
“You have the really big ones from thousands of years ago,” Montgomery said, “But why did the piece of the slope fail that did? It was different from some other areas up and down the valley due to the history of failure in recent decades, which exacerbated the stability problem.”
The report raised a question that was brought up in the immediate aftermath of the slide: what role did logging play? But the authors said that they were “not in a position to answer the question of what degree forest practices contributed to this slide.” Any conclusions would require further modeling and were beyond the scope of this four-day reconnaissance effort, they said.
Logging can contribute to weakened root strength, allowing hillsides to slough off in heavy rain. But Montgomery said the team was pretty comfortable ruling out that idea because the slide was too big and roots would have been too thin to make a difference in preventing the massive amount of earth from loosening.
Another potential connection to logging is from the removal of trees that would otherwise have absorbed some of the precipitation, preventing it from seeping deep into the soil and loosening it. Groundwater seems to have been a key contributor to the destabilization of the slope near Oso, the report authors concluded. Montgomery said the team saw seeps of water coming into the exposed face, or scarp, of the landslide from neighboring creek basins to the east.
“We located five or six groundwater seeps where water is coming out of the wall of the slide and forming a little stream that is running across the scar,” Montgomery said. That stream could have destabilized the earth far below the surface of the slide, contributing to its size and extensive runout zone.
The authors concluded that methods to identify and predict potential landslide runout zones need to be revisited and re-evaluated. The use of LIDAR imagery could also provide a great deal of assistance in gathering historic evidence that landslides of this magnitude have run across the valley before, said Jeff Keaton, a principal engineering geologist with AMEC Americas, who contributed to the report.
“That would be a really helpful step in understanding how widespread this kind of process actually is,” he said.
But there’s more digging to be done, literally, said Joe Wartman.
“The hole we have at this point is understanding what was going on underneath the ground surface,” Wartman said. “I think the next big thing is drilling holes into that landslide and the nearby vicinity to get an understanding of what is underneath that large landslide.”
The authors called for further modeling in order to better understand to what degree logging or the Stillaguamish River, which was eating away at the toe of the slope, may have contributed to the catastrophic slide.
The USGS and others will be conducting field research in the coming months. You can read the full report here.