Tribes partner to survey forestlands with LIDAR

An aerial photo (above) is compared with the LIDAR model.

Source: Northwest Indian Fisheries Commission

The Stillaguamish and Tulalip tribes have partnered with the state Department of Natural Resources and three private timber companies to map forestlands in the Stillaguamish and Skykomish basins.

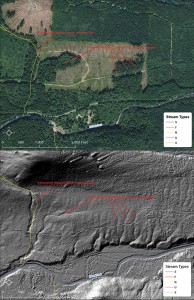
LIDAR, which stands for Light Distance and Ranging, uses an airborne laser to survey topography.

“The laser pulses from the plane are reflected back to record billions of points of light that measure elevation,” said Derek Marks, Timber/Fish/Wildlife biologist for Tulalip.

Elevation data was collected on working forestlands and a large area of Mount Baker-Snoqualmie National Forest. The result is a high-resolution model that enables natural resources managers to identify resources and potential risks, such as landslides.

“We can save many hours with high-resolution models,” Marks said. “We don’t have to walk the hillside; a forester would have to traverse the area to know where the streams are.”

The new LIDAR surveys covered an area that previously had not been mapped, where the forest canopy covers streams. The models will guide environmental permit reviews for logging and road proposals.

“We’re also reflying the entire North Fork Stillaguamish corridor to compare the data with LIDAR from 2003, to see what’s changed in a 10-year period,” said Scott Rockwell, Timber/Fish/Wildlife biologist for Stillaguamish. Those surveys will cover tribal restoration projects on the North Fork.

“It streamlines management and risk assessment for private industry and state lands,” Rockwell said. “It allows tribes to prioritize and scope restoration projects where we can see obvious habitat potential.”

The surveys were coordinated by the Puget Sound LIDAR Consortium, an informal group of federal and local agencies that acts as a clearinghouse for the high-resolution topographic models, making the data available to the public.

Scorched Earth Policy: Indian Country Among Climate Hot Spots

Wildlife Conservation SocietyThe map illustrates the global distribution of the climate stability/ecoregional intactness relationship. Ecoregions with both high climate stability and vegetation intactness are dark grey. Ecoregions with high climate stability but low levels of vegetation intactness are dark orange. Ecoregions with low climate stability but high vegetation intactness are dark green. Ecoregions that have both low climate stability and low levels of vegetation intactness are pale cream.
Wildlife Conservation Society
The map illustrates the global distribution of the climate stability/ecoregional intactness relationship. Ecoregions with both high climate stability and vegetation intactness are dark grey. Ecoregions with high climate stability but low levels of vegetation intactness are dark orange. Ecoregions with low climate stability but high vegetation intactness are dark green. Ecoregions that have both low climate stability and low levels of vegetation intactness are pale cream.

Source: Indian Country Today Media Network

Southern and southeastern Asia, western and central Europe, eastern South America and southern Australia are among the regions most vulnerable to climate change on Earth, a new map compiled by the Wildlife Conservation Society shows. But Turtle Island and much of Indian country are not far behind.

This map, unlike previous assessments, factors in the condition of the areas surveyed rather than simply looking at climate change’s effects on landscapes and seascapes. The human activity that has shaped many of these regions already must be factored in, the map’s creators said in a statement, because that helps determine how susceptible the areas will be to the influences of the world’s changing climate.

“We need to realize that climate change is going to impact ecosystems both directly and indirectly in a variety of ways and we can’t keep on assuming that all adaptation actions are suitable everywhere,” said James Watson, who led the study as director of the Wildlife Conservation Society’s Climate Change Program, in a statement from the WCS on September 17.

“A vulnerability map produced in the study examines the relationship of two metrics: how intact an ecosystem is, and how stable the ecosystem is going to be under predictions of future climate change,” the society said in its statement. “The analysis creates a rating system with four general categories for the world’s terrestrial regions, with management recommendations determined by the combination of factors.”

The dark green areas of the map, which are much of northern Canada, delineate areas of low climate stability but a high rate of intact vegetation, the society said. Wildlife Conservation Society scientists were joined in the map’s creation by researchers at the University of Queensland in Australia and Stanford University in California. The research was published in the journal Nature Climate Change.

One of the goals of compiling the map was to determine the best places to invest conservation resources, the society said. The areas with the most stable climate have the best chance of preserving species if efforts are amped up there, the society said.

“The fact is there is only limited funds out there and we need to start to be clever in our investments in adaptation strategies around the world,” Watson said. “The analysis and map in this study is a means of bringing clarity to complicated decisions on where limited resources will do the most good.”

RELATED: The Seven Most Alarming Effects of Climate Change on North America, 2013 Edition


Read more at http://indiancountrytodaymedianetwork.com/2013/09/18/indian-country-among-climate-change-hot-spots-highlighted-vulnerability-map-151332