
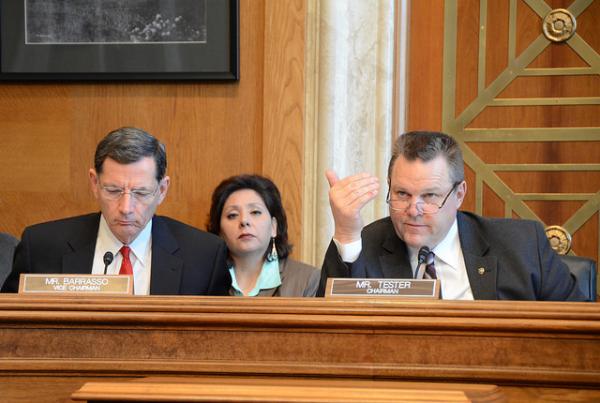
Senate Committee on Indian Affairs Vice Chairman John Barrasso, R-Wyoming, and Chairman Jon Tester, D-Montana, listened to testimony at the committee’s hearing on American Indian students in public schools.
The federal government recently took a look at how American Indian children are faring in public schools—and the results are disturbing.
Minority children in public schools are generally subjected to harsher, more frequent disciplinary measures than are white students, according to the report, “School Discipline, Restraint, & Seclusion,” released by the U.S. Department of Education Office for Civil Rights. The data collection that served as the basis of the report covered all 97,000 public schools in the U.S., which serve 49 million pre-K through grade 12 students. Between 90 percent and 95 percent of American Indian and Alaska Native children are educated in public schools.
“The issue of unlawful racial discrimination in school discipline is… a civil rights issue,” states a U.S. Department of Education spokesperson. “Title VI protects students from discrimination based on race in connection with all academic, educational, extracurricular, athletic, and other programs and activities of a school, including programs and activities a school administers to ensure and maintain school safety and student discipline.
A few examples of the government’s findings: AI/AN children, who represented 0.5 percent of enrollment of the schools included in this calculation, accounted for 2 percent of single and multiple out-of-school suspensions and 3 percent of expulsions. On the other hand, they accounted for only 0.2 percent of in-school suspensions. By contrast, white students, who accounted for 51 percent of enrollment, comprised 40 percent of in-school suspensions, 36 percent and 31 percent of single and multiple out-of-school suspensions respectively and 36 percent of expulsions. These numbers suggest that the harsher the punishment (with in-school suspension at one end of the scale and expulsion at the other), the less likely is it to be applied to white students and the more likely it is to be imposed on AI/AN children.
Thirteen percent of AI/AN boys received out-of-school suspension, compared with 6 percent of white boys. Seven percent of AI/AN girls received out-of-school suspension, compared with just 2 percent of white girls.
More than twice as many students with disabilities received out-of-school suspensions (13 percent) than did non-disabled students (6 percent). A whopping 29 percent of AI/AN boys with disabilities received out-of-school suspensions, compared with 12 percent of white boys. Twenty percent of AI/AN girls with disabilities received out-of-school suspensions, compared with 6 percent of white girls with disabilities.
“The administration of student discipline can result in unlawful discrimination based on race in two ways: first, if a student is subjected to different treatment in discipline based on the student’s race, and second, if a discipline policy is neutral on its face—meaning that the policy itself does not mention race—and is administered in an evenhanded manner but has a disparate impact, i.e., a disproportionate and unjustified effect on students of a particular race,” explained the spokesperson.
The Office for Civil Rights can investigate potential violations if the data warrants. “The data showing disproportionalities by race and ethnicity provide a basis for OCR to investigate further, including all relevant circumstances, such as the facts surrounding a student’s actions and the discipline imposed, to determine whether there was discrimination.” For example, a September 2012 investigation of Oakland, California schools resulted in a “voluntary resolution agreement [that] addressed issues of whether African American students were disciplined more frequently and more harshly than white students,” says the department spokesperson.
A Senate Committee on Indian Affairs oversight hearing titled “Indian Education Series: Indian Students in Public Schools—Cultivating the Next Generation,” also found areas of concern, particularly in relation to Impact Aid.
William Mendoza, executive director of the White House Initiative on AI/AN Education, noted that the Office for Civil Rights report found other discrepancies in the education of AI/AN kids. For example, American Indian kindergarteners repeat the grade at nearly twice the rate of white children, AI/AN students go to schools with more first-year teachers than do white students and AI/AN students have the highest dropout rate of any racial or ethnic population, with a graduation rate of just 68 percent, compared with 75 percent for all students.
Mendoza testified that Impact Aid to help fund education for schools in districts with untaxable federal lands was funded at copy.2 billion for FY 2014, with half of that money going to public schools that educate children living on Indian lands.
Brent D. Gish, executive director of the National Indian Impacted Schools Association, put that number in perspective. While the Impact Aid program was established by Congress in 1950, it has not been fully funded since 1969. According to Dan Hudson, Wyoming State Impact Aid chairman and assistant superintendent of Fremont County School District #14, the Basic Support component of Impact Aid is currently funded at only 58 percent of authorization while the Payments for Property component is funded at just 3.5 percent of authorization.
Gish also noted that the Impact Aid program is not forward-funded, presenting challenges for planning and hiring. The 2013 federal sequester added to those challenges. “The sequester hit federally impacted Indian land school districts hard and to the detriment of the students, their communities and reservations,” he testified.
RELATED: Every Child Left Behind: Sequester Guts Indian Education, Part 3
But there is good news too, as a number of panelists testified. For example, Alberto Siqueiros, superintendent of the Tohono O’odham Nation’s Baboquivari Unified School District, told the committee how his school district is in the process of completely transforming itself from a mediocre educational endeavor into an excelling school district by putting everything—from teacher hiring to community involvement and expectations for both faculty and kids—on the table.
“Long gone are the days of low expectations, mediocre performance and results often seen in tribal educational settings. We insist that the entire BUSD community support our efforts in educating our children,” he said. The results so far include a nearly 40 percent increase in graduation rates in the past five years, six Gates Millennium Scholars and one Dorrance Scholar in the past three years and over $2 million in scholarships in 2013. In that year, 52 seniors graduated, 30 applied to college, 24 were accepted and 19 enrolled in college.
Read more at http://indiancountrytodaymedianetwork.com/2014/06/03/not-separate-not-equal-feds-look-native-kids-public-schools-155085?page=0%2C2

 Published in Print: May 14, 2014, as Authors Contend Public Schools Outperform Private Schools